Introduction:
Learn how to monitor your website's server-side performance in Plesk using Grafana. This tool enables you to track CPU and memory usage, providing valuable insights to optimize your website's performance.
Approximately 10 Minute Process
Step-by-Step Guide
1. Login to Plesk from your Zeniar Portal
2. Click on the Website & Database tab from the left toolbar

3. Expand the website you wish to monitor

4. Under Dev Tools, click on the Monitoring option
![]()
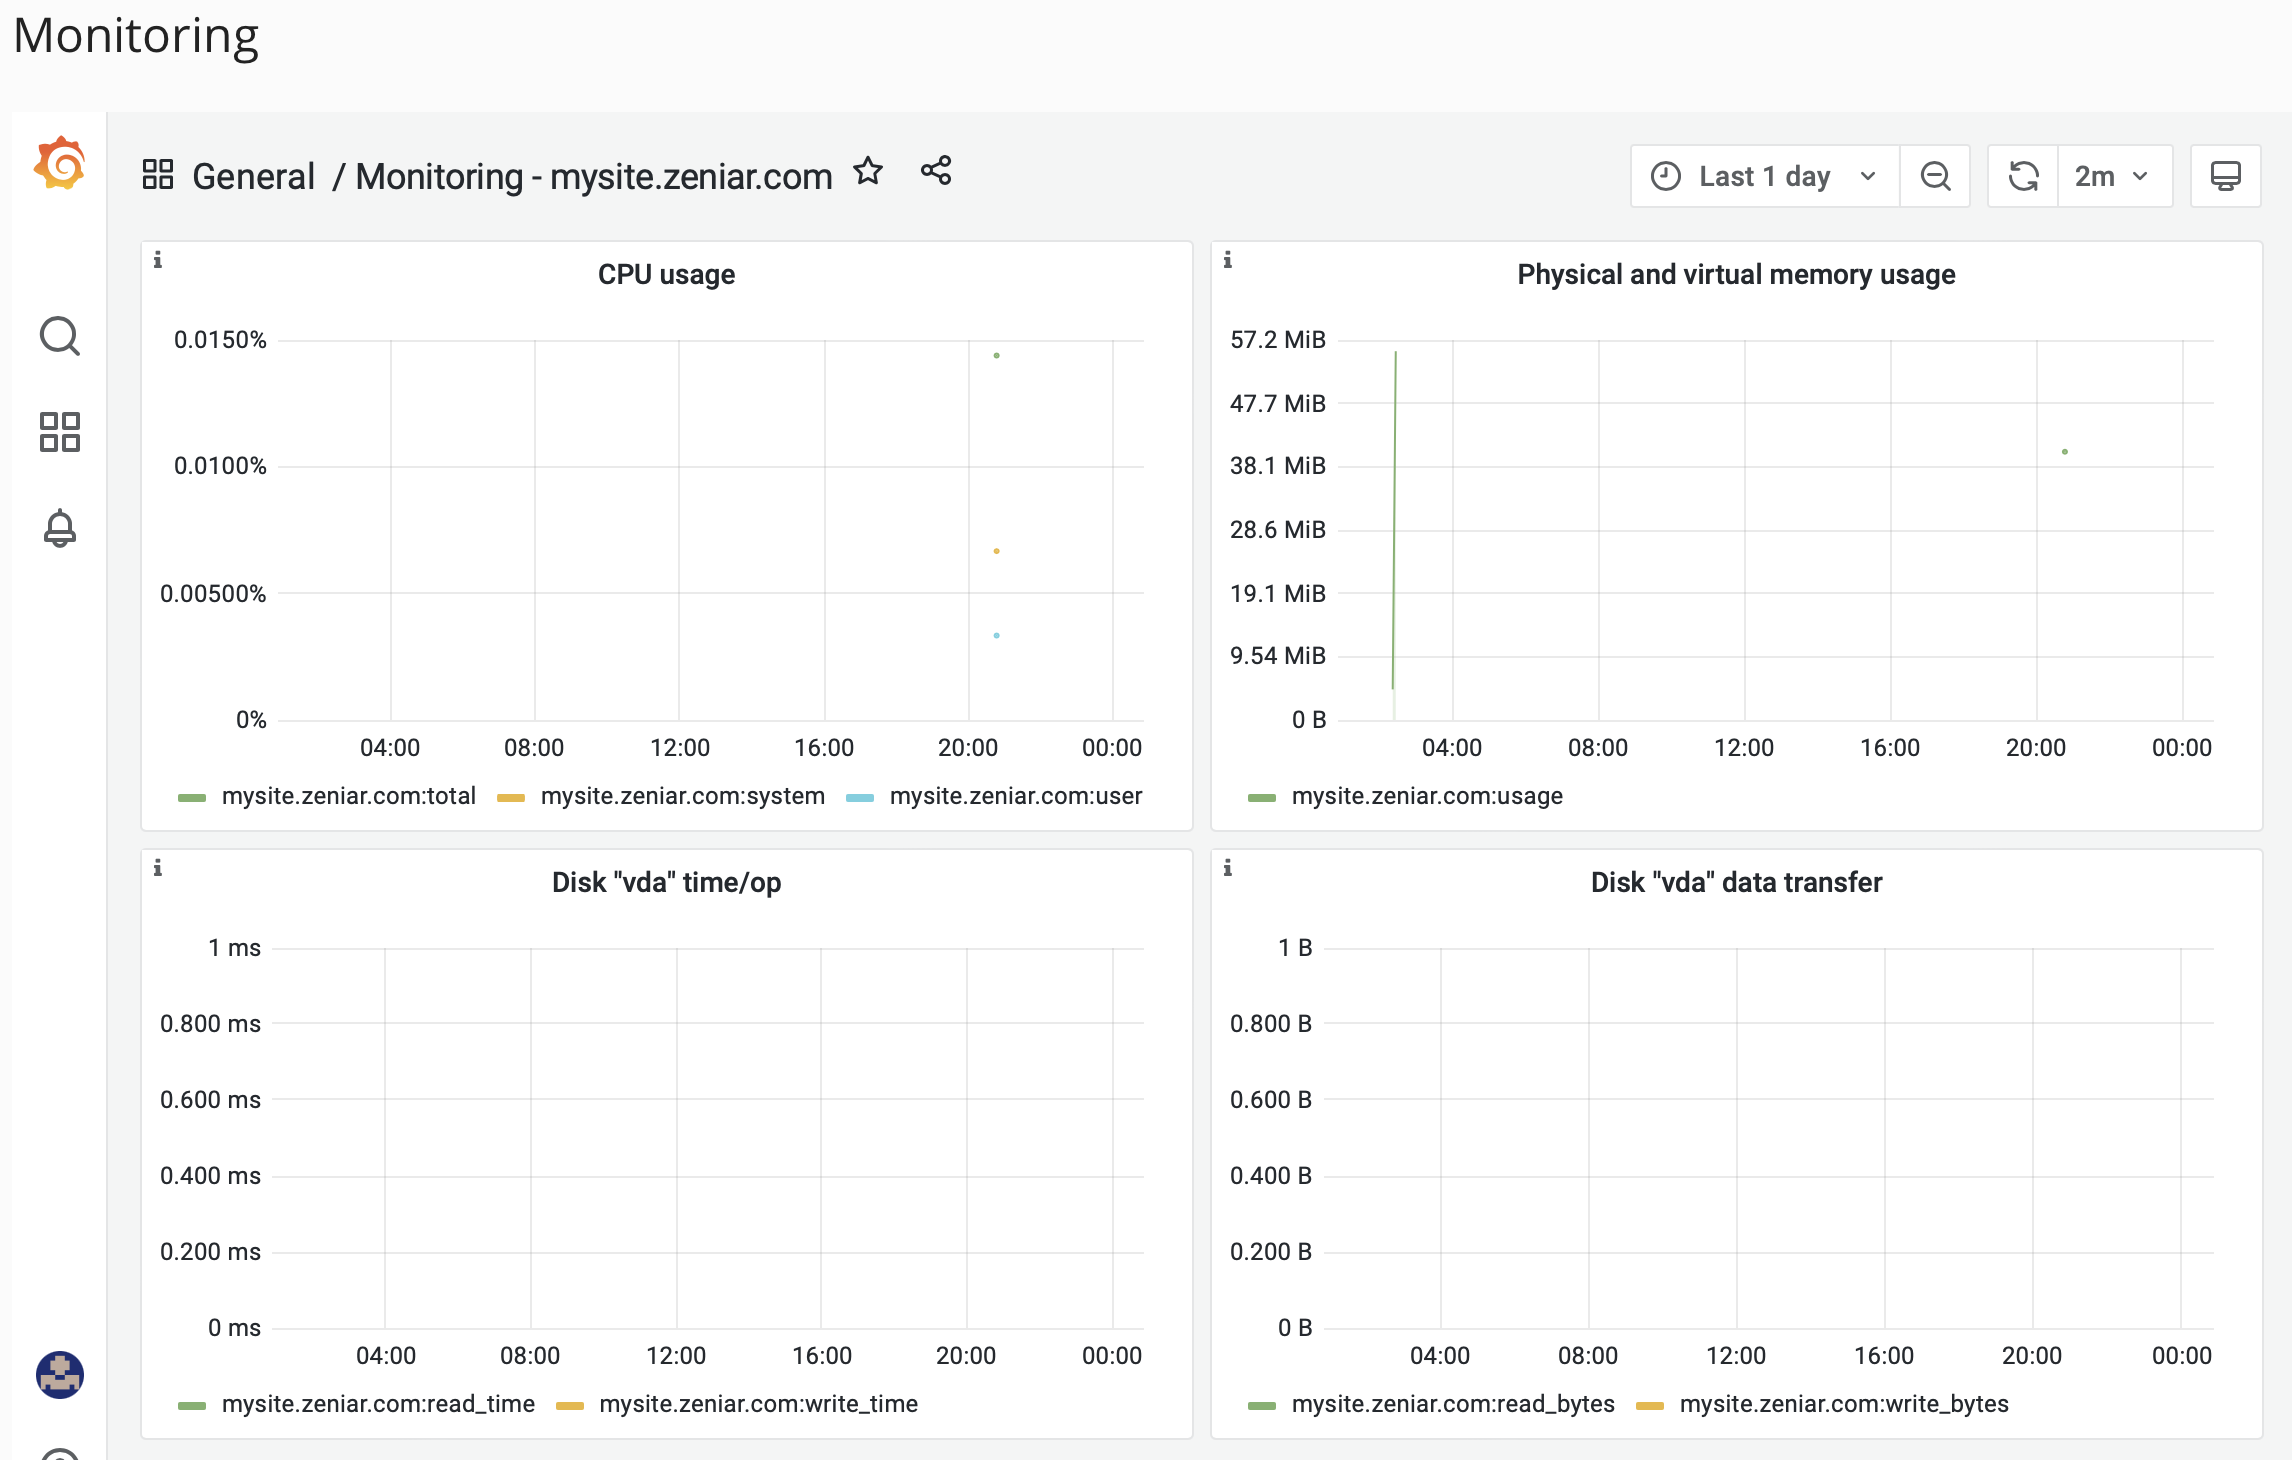
5. From the top right, you can adjust the time period and the refresh time from the drop down menus
![]()
6. The dashboard will then be displayed for your site
Require additional assistance?
Our dedicated Australian support team is ready to help. Reach out to us via email at support@zeniar.com or by submitting a support ticket through your Zeniar Portal.

